
Anja Johansen (1), Idun Knutsdatter Østerdal (2)
- Medicine and Health Library, Norwegian University of Science and Technology, Trondheim, Norway
- Medicine and Health Library, Norwegian University of Science and Technology, Trondheim, Norway
anja.johansen@ntnu.no, Idun.k.osterdal@ntnu.no
Keywords: library space; libraries, medical; learning environment; user studies; user location mapping; science communication
Abstract
As more and more library collections are digitalized, ideas about what libraries should be and what kind of services they should offer are changing. Research on user expectations towards the public library space point to ideas about the physical library as an important meeting place, and as a “third place”. Although university libraries are also public spaces, their main aim is to assist study and research at the university. Therefore, it is important to understand what students, researchers and staff at university libraries expect and want from the library space. Considering the vast amount of online information provided by libraries today, why would students and staff come to a physical library at all? Does the digitalization of collections reduce the library space to reading rooms and casual hangouts? Can the physical space offer room for new knowledge beyond what is accessed online?
In this paper, we present current, on-going research on and development of the library space at the Medicine and Health Library at the Norwegian University of Science and Technology, which moved into new facilities in 2013. The library is located in the Knowledge Center in the middle of Trondheim’s integrated university hospital. Our aim is to develop the library into an inspiring learning environment for student and researchers, as well as offer an arena for science communication.
In our on-going research we have explored and mapped how the library space is used and what the different user groups expect and want from the library space. We have used both quantitative and qualitative methods, including surveys, user location mapping, photography and user participation through workshops and social media. So far, the research indicates that users want various spaces for different activities, such as focused individual study versus group work as well as spaces for relaxation and social interaction. Based on this we have started to develop different zones in the library, and established collaborations with researchers and other actors at the university hospital in working with seminars and small exhibitions.
The library space is still an important learning arena for students and researchers, but we will argue that we still need to explore ways of connecting the virtual and physical library. A common challenge in user research is to process and interpret collected data. The paper will discuss such challenges, as well as ways to identify, implement and evaluate measures.
Background
As more and more library collections are digitalized, ideas about what libraries should be and what kind of services they should offer are changing. (1) Research on user expectations towards the public library space point to ideas about the physical library as an important meeting place, and as a “third place”. (2) Although university libraries are also public spaces, their main aim is to assist study and research at the university. Therefore, it is important to understand what students, researchers and staff at university libraries expect and want from the library space. Considering the vast amount of online information provided by libraries today, why would students and staff come to a physical library at all? Does the digitalization of collections reduce the library space to reading rooms and casual hangouts? Can the physical space offer room for new knowledge beyond what is accessed online?
Our current research is part of the larger, ongoing user-based development of the Medicine and Health Library (BMH) at the Norwegian University of Science and Technology (NTNU) and St.Olavs Hospital following the opening in 2013. The process involved merging two previous libraries, at the University College Sør-Trøndelag and NTNU respectively. As part of this process we initiated a user survey (3) based on individual responses as well as focus group interviews. The aim was to map existing library users’ expectations and hopes for the new library. The results showed differences in the ways students and employees viewed the library: While students regarded it as their physical workspace, employees valued the library’s online services most. Both groups wanted to keep the existing library services, and wanted a spacious and functional library.
Although this survey was useful for planning the new library, we need to know more about the factual use of the library and current needs from our users. The new building is constructed as a passive house, which means that windows cannot be opened but temperature is automatically regulated. This has its advantages and challenges which we will return to later.
Research questions and aim of paper
In this paper, we present current, on-going research on and development of the library space at BMH. Our overall aim is to develop the library into an inspiring learning environment for student and researchers, as well as offer an arena for science communication.
For this paper we focus on questions and findings from research undertaken this semester (Spring 2016). Research questions have been as follows; 1) What do the users of the library like about the physical library spaces/facilities? 2) What are they less content with? 3) Are there facilities or services they would like us to offer that we do not have today?
We also present and discuss methods for mapping user behavior and experience, as well as ways to think about implementing measures.
Methods and material
The methods in our research and this paper are influenced by research on user experience (UX) in design studies. This approach has been widely used in developing public services, including libraries (4). In short, this means asking questions like: What do users think and want from the library? How to access this knowledge?
A key insight from UX is the importance of continuous testing, by making input from users a part of the development process – from strategy to implementation and evaluation. In our research we use different methods, both quantitative and qualitative. They vary in scope and elaboration, from longer online surveys, individual and focus group interviews, to shorter more improvised methods of observation, photography and 5-minute interviews of users on site in the library.
The quantitative methods were developed and tested during Spring 2015. Two interns from Oslo and Akershus University College of Applied Sciences conducted a two week study using traffic counting and short interviews (5). The project gave insights on counting of traffic as method, as well as valuable data on library use. We continued counting traffic using the same method Fall 2015, and modified the counting process to include qualitative observations Spring 2016. This included using the field for comments more actively to indicate user behavior and levels of noise in different zones.
In March 2016 we attended a workshop on UX for libraries, with invited speakers and facilitators from the UX-team at Oslo University Library (6). The team encouraged us to explore new methods for gathering user perspectives, influenced by ethnography and design studies (7). Among the methods introduced and tested at the workshop were storytelling (“tell me about the last time you visited the library..”), cognitive mapping (“draw a map of the library..”) and open interviews on a given topic.
In this paper we primarily base our findings on an in-depth interview and cognitive mapping with a student attending the UX-workshop, as well as 12 shorter interviews with different users on-site in our library.
Findings and actions
Method 1: Counting traffic
At a later stage we will examine the numbers collected this spring in more systematic ways, including statistical analysis. For this paper we have mainly focused on observations during counting and done a quick visual mapping. Observations from the forms included:
- use of private laptops versus our public computers
- use of headphones
- working alone or together
- levels of noise in different areas
- re-arrangements of furniture by users
The visual mapping was done using color markers indicating the above mentioned observations on maps of the library premises. This was done in order to quickly detect any patterns of use, e.g. which group study rooms or study spaces were most popular, and if some areas were more quiet than others etc. Our first impression is that some areas stand out as more quiet than others without any intervention from us, and that areas with talking overlap with high usage of headphones. Group rooms and study spaces near windows seem popular, and the majority of users working on a computer use their own laptops (even on study spaces with public computers).
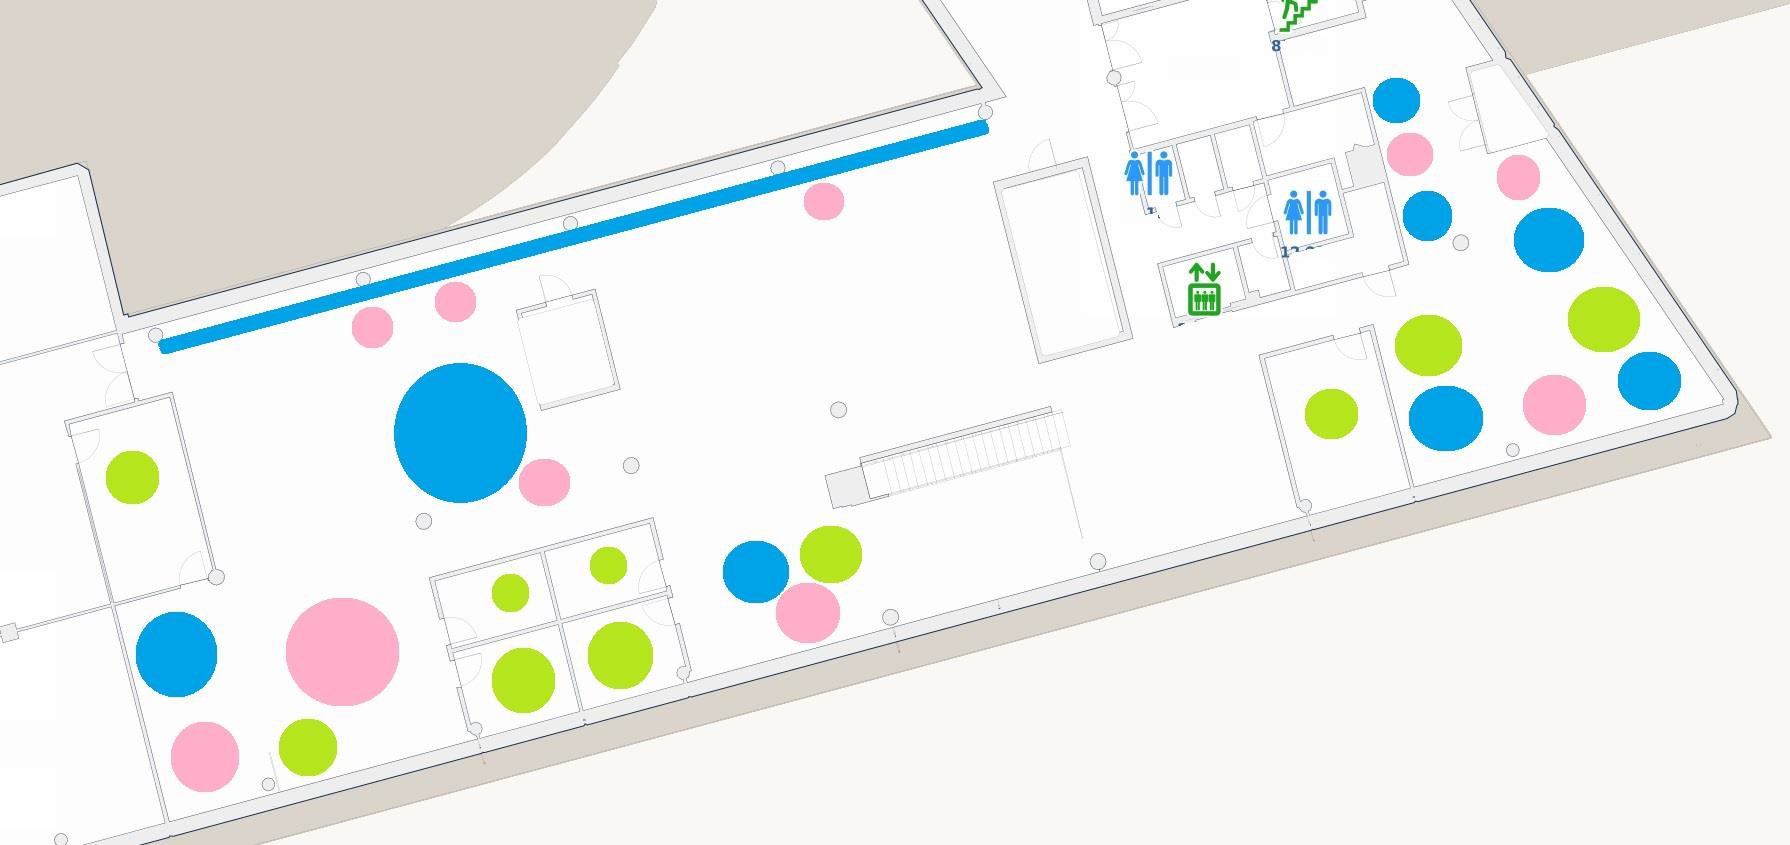
Fig. I Visual mapping of 2nd floor south wing. Green: group work, blue: solitary work, pink: use of headphones.
Method 2: Open interview during UX-workshop
We conducted an hour long interview with a 3rd year student who is an active user of our library. We started out with some open questions about her use of the library (“What do you use the library for?”), and followed up interesting statements. We also included a cognitive mapping of the library.
In short, she reported that she mainly used the library for browsing through the shelves, borrowing books and using group study rooms. The map she drew of the library als o confirmed that physical collections and group study rooms (with screens) were important facilities.
We mainly asked her to tell us about her own study habits, but she also provided insights into her classmates study habits, use of study spaces and library resources. Although they were overall happy with the variation and quality of furniture and spaces, a recurring frustration was bad air quality in group study rooms. They also wanted a water dispenser.
Method 3: Short interviews on site
We conducted 12 interviews, including 16 users as some were interviewed in pairs. 14 of these were students, two were employees (at the Faculty of Medicine and St.Olavs Hospital). Overall the users we asked were very content with the physical library space and facilities. As in this comment from two 4th year students:
“It is bright and spacious here! I like the varied work spaces – I can use a sofa while reading or a desk for writing.”
Several of the students also liked that it was quiet but not too quiet, so that they could talk while working. However, some complained about air quality, especially in the group study rooms, as well as the lack of a safe space for charging their laptops.

Fig. II 4th year students, using a corner with comfy seating and low tables for reading and writing.
We also asked them to respond to different suggestions for development, based on our previous studies, which seemed to resonate with the students:
“It would be nice to have more standing work spaces with ergonomic mats.” Student 5th year
“I think a meditation space would be good. To be distracted from working for a while, lower my shoulders and stretch a bit.” Student 1st year
Although most of the respondents were students actively using the library for studying, others had only come by to return books or use the printer.
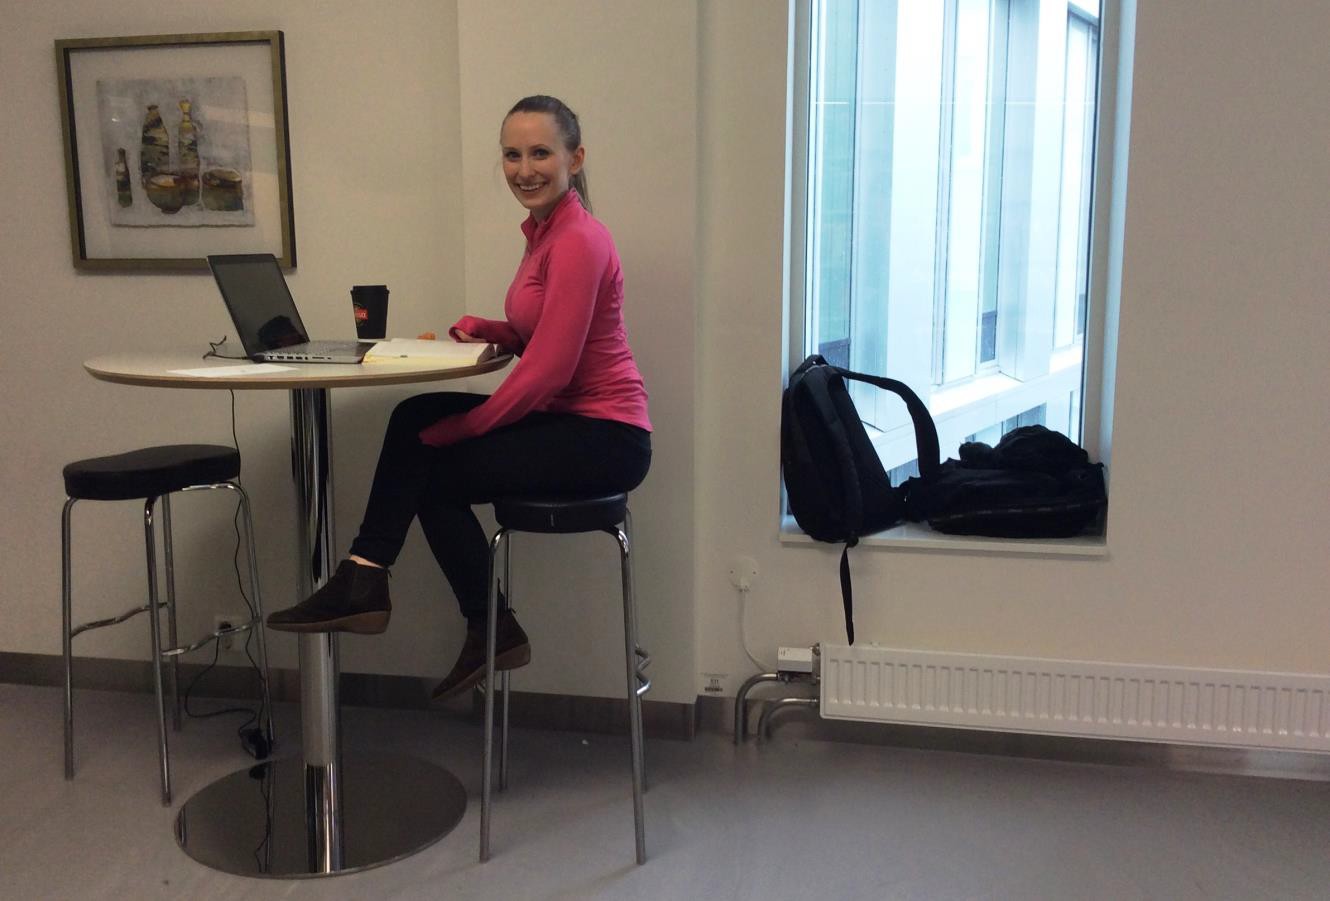
Fig. III 1st year student using a tall table for reading and writing, and the windowsill for her bag and clothing.
Actions based on findings
The UX-method calls for dividing findings and measures into three categories:
- Immediate measures that can easily be implemented without any/large costs.
- Measures that are possible in the near future, but that demand more planning and work as well as smaller investments.
- Unrealistic ideas which cannot be implemented by our initiative alone, and which involves high/unknown expenses.
From our interviews and traffic counts, we mapped out several measures and have started implementing some of them. In category 1 this includes providing sheltered spaces for quiet study versus more open, active group work zones, and integrating information on e-resources in the physical library (in exhibitions and shelves). In category 2; setting up lockable stations for charging of mobile phones and laptops and installing a water dispenser for hot and cold water. We also got positive feedback on our planned developments such as establishing a new graphic medicine novel collection and reserving a work space for students with children.
The only feedback so far categorized as unrealistic ideas (category 3) is to change windows into ones that can be opened. Although this seems beyond our capacity, what we can do is to make sure that the complaints about bad air quality are passed on to those responsible. One way to do this more systematically is to provide forms for feedback on air quality in the group study rooms.
Discussion and conclusions
In our ongoing research we have used several methods, resulting in different types of material for further study. The methods each have their advantages and challenges. Below we discuss some of our experiences using them.
The initial round of traffic counting in 2015 identified some general activity zones, but the method gave little insight into more qualitative aspects of use, e.g. what users think about the facilities or what services they would like us to provide. Extracting findings from this data is also challenging as it depends largely on what you have looked for from the beginning. However, it can give an overall picture of what areas in the library are used the most and at what times of the day.
In-depth user interviews has provided more qualitative findings, such as needs and wishes from our users. It also works as a means of making the users aware of their own library experience and their opportunity to shape the library. We can warmly recommend using this method in smaller and bigger scale. Short, informal and frequent interviews work well for a library our size, and has the benefit of providing insights into different users habits, needs and perspectives. The data collected from in-depth and informal interviews has proven to be easier to process and transform into actions, than the quantitative data.
A widely recognized challenge in user research is to process and interpret collected data. Our experience with qualitative and quantitative methods is that both approaches give large amounts of data, although in different forms. We were able to limit the amount of collected data somewhat by conducting quantitative research before the qualitative interviews. Findings from traffic counts gave us a basis for mapping the library space and enabled us to pinpoint target areas for further research through interviews.
We are still processing data collected through interviews and traffic counting. However, this does not have to stop us from implementing measures. Continuous testing is a central point in UX design studies, and means that testing can be done at different stages of development. Throughout our research we have started with asking users what they want or need. Based on the findings, as well as examples of successful library design projects nationally, we then plan and implement actions. These can, in turn, be tested with users again to see if the realization of an idea worked as planned.
Our experience is that new ideas for development are most efficiently formed through direct interaction between staff and users, and that the role of the interviewer is key to facilitate the dialogue about future development of the library. Working with user-based development of a library does not have to mean that librarians cannot suggest and initiate development themselves, but that this is best done in dialogue with users.
References
- University of Oslo Library. Åpne bibliotek? Endring, tilpasning og legitimering i nasjonal- og universitetsbibliotek [Internet]. Oslo: 2015 [10.05.2016] Available from:
http://www.ub.uio.no/om/prosjekter/apne-bibliotek/ - Aabø, S., Audunson, R. Use of library space and the library as place, Library & Information Science Research. 2012; 34(2): 138-149
- Sentio Research Norge AS. Tilgjengelighet, fleksibilitet og kompetanse. En fokusgruppeundersøkelse om brukernes ønsker og forventinger til det nye Bibliotek for medisin og helse [Internet]. Trondheim: 2012. [10.05.2016]. Available from:
http://www.ntnu.no/ub/fagside2/medisin/pdf/Rapport,%20fokusgruppe,%20Bibliotek%20for%20medisin%20og%20helse.pdf - IDEO. Design Thinking for Libraries. A toolkit for patron-centered design [Internet]. [10.05.2016]. Available from:
http://designthinkingforlibraries.com/ - Samarbeidsutvaglet for bibliotekstatistikk [Blog on the Internet]. The Norwegian Cooperation Committee for Library Statistics; 2012- . [10.05.2016]. Available from:
https://samstat.wordpress.com/ttt/ - University of Oslo Library. Library-UX: Tjenesteutvikling med fokus på brukeropplevelse i biblioteket [Internet]. 2015 [27.02.2015; 10.05.2016]. Available from:
http://www.ub.uio.no/om/prosjekter/library-ux/ - Soverini, Andrea. UX Project Checklist [Internet]. [10.05.2016]. Available from:
https://uxchecklist.github.io/