 |
Measuring the performance of a biomedical digital library: web site, e-journals and databases. Paolo Gardois
|
||||||||||||||||||||||||||||||||||||||||||||||||||||||||||||||||||||||||||||||||||||||||||||||||||||||||||||||||||||||||||||||||||||||||||||||||||||||||||||||||||||||||||||||||||||||||||||||||||||||||||||||||||||||||||||||||||||||||||||||||||||||||||||||||||||||||||||||||||||||||||||||||||||||||||||||||||||||||||||||||||||||||||||||||||||||||||||||||||||||||||||||||||||||||||||||||||||||||||||||||||||||||||||||||||||||||||||||||||||||||||||||||
|
Click here to see the ppt presentation |
|
||||||||||||||||||||||||||||||||||||||||||||||||||||||||||||||||||||||||||||||||||||||||||||||||||||||||||||||||||||||||||||||||||||||||||||||||||||||||||||||||||||||||||||||||||||||||||||||||||||||||||||||||||||||||||||||||||||||||||||||||||||||||||||||||||||||||||||||||||||||||||||||||||||||||||||||||||||||||||||||||||||||||||||||||||||||||||||||||||||||||||||||||||||||||||||||||||||||||||||||||||||||||||||||||||||||||||||||||||||||||||||||||
 |
Abstract
Measuring the usage of electronic
resources is vital both for the collection development strategy and to
plan an efficient training program for users.
General introduction In the academic and scientific context
web-based digital libraries have acquired a growing importance during the
last years. Many libraries have understood the importance of delivering
services via the web, but after few years of experiments there is a strong
need to end the "beta versions" of libraries' web sites.
the web has contributed to develop a global marketplace for scientific information. Commercial providers, publishers, software houses now compete with libraries to deliver information in a disintermediated environment; in the public but also in the private sector the budgets for acquiring books, journals and databases have considerably decreased during the last decade, thus determining a need for money saving and focusing on fewer, more relevant resources users are confronted with many different tools for information retrieval, such as search engines, online catalogues of any kind, online databases. On the other hand, the mass of information is growing so rapidly as never before: this means, using Ranganathan' words "save the time of the reader". Thus, users can easily judge an interface "too difficult to use", or a web resource "not interesting enough". Libraries' websites, then, have to concentrate on quality - simply in order to survive. Offering basic information such as opening hours or colourful photographs of reading rooms is not enough anymore. And quality has two sides, in my opinion: global and local. Global: being part of cooperative projects such as union catalogues, indexing initiatives, consortia and deliver access to resources whose importance is widely acknowledged. Local: concentrating strongly on local users, tayloring services on their needs, and try to acquire new users - yes, even in the scientific environment, where users have usually been taken for granted until now. Obviously, there is not only one strategy: marketing and advertising techniques, acquiring a more important role in users' education, integration with other departments working on the same issues (IT, for example) and with the scientific research (university press, assistance to authors), all are good examples of a right way to follow. There is a common need, though: receiving feedback from users, and building and restructuring the services offered paying particular attention to this feedback. A web environment offers particularly
favourable occasions to track users' behaviour. More or less every move
of a user in a digital environment leaves traces. Mining and interpreting
these data - something half way between Sherlock Holmes and Amazon's sales
department - may be vital for the evaluation and the future development
of a library's web site.
This is why I think that the experience
of measuring our digital library for more than one year might be interesting:
with its limits and errors, as much as with the parameters and the strategy
of analysis.
Web server log analysis Introduction I have created the website of the Library of the Pediatric and Adolescent Medicine Department in August 1999. In June 2000 the site underwent a major reorganization involving both the graphical aspect and the architecture, although its content and target audience haven't changed significantly. Technical data, services offered and typology of users are reported in table 1: Table 1
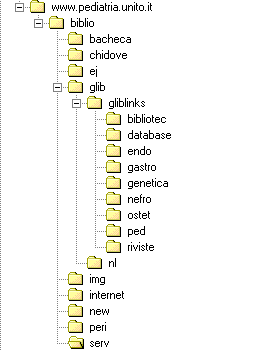
Figure 1. The structure of the web site
I have collected and analyzed data
from the web server hosting my library's web site for the following periods:
Here it as an example of a line from
the web server log:
The sequence shows: the IP address of the user ; date and time ; file required ; code for "download successfully completed" ; number of bytes transferred. The referrer function was not enabled: thus, it is not possible to have information about other sites pointing to this web site. Besides, this log does not indicate the user's browser, nor does it show whether a spider or robot has indexed the pages. This last function should be very useful to limit the analysis only to hits from "real" users. To analyze the server log I have
used:
Overview of the site: general statistics Table 2 summarizes the most important data about the web site usage in the whole period considered, confronting it with the initial period (1999-09-20 - 1999-12-13) and the final period (2000-11-01 - 2001-01-31). Table 2 - Generated On Monday April 30 2001 - 21:02:11
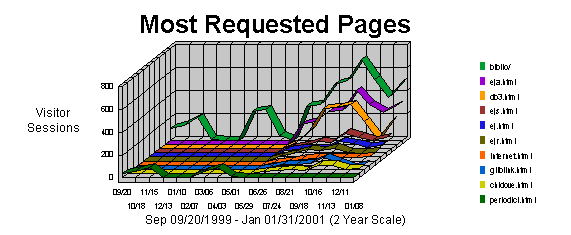
Figures describe a web site significantly more used in terms of quantity after 13 months from the first measurement, but the length of visitor sessions has increased only very slowly. To help increase the time spent by users on the site, it would probably be necessary to add more content and a more complex organization. The most requested pages and files Graph 1
Not surprisingly, the most requested page is the home page, followed by the lists of e-journals and links to databases and other Internet resources. Basic information such as opening hours and address is not very required. Additional statistics, not reported here, show that the home page is also the top entry page (35% of total) and the top exit page (24% of total). Since the structure of the web site is very simple and not very deep (see tree in figure 1), the most accessed directories are the ones containing the most requested files (such as the home page or the pages commented in the previous paragraph). Users: a profile: who, from where, when All we can see from log files are
domain names or IP addresses contacting our web server.
After that, who accesses the Internet through a Internet service provider (ISP) is assigned any time a different IP by the ISP (dynamic IP): this is why different IPs do not always mean different users. Besides, proxy servers hide the different IPs of single users. Another problem are "spiders" and robots, used by search engines and web directories to scan and automatically index web sites. In order to exclude spiders' hits from the total number of hits on your web server, it is necessary to enable the recognition of the user agent (usually declared by most common robots) on the server itself. All this given, let's pass on to
some "positive definitions".
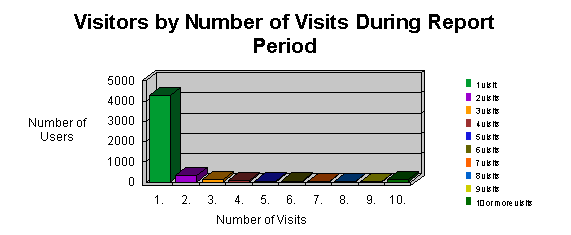
The duration of the visit is a very important parameter to study the interest of the user towards the web site. Also the percentage of users returning to the site helps us to establish if the site is used regularly or not: in general, if a user appreciates the service, he or she will come back often. Graph 2
From this graph we understand that
the majority of users (85,40%) haven't come back to the site after visiting
it the first time. It is then necessary to study new strategies to attract
the user with more peculiar content, which it is not possible to find easily
elsewhere.
Graph 3
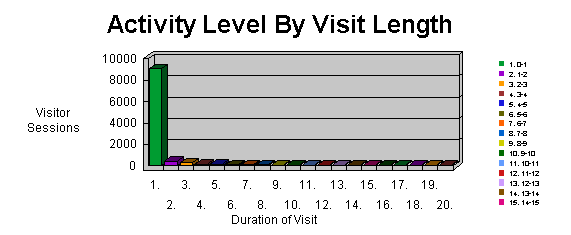
Graph 3 shows the importance of another parameter: the length of a visit. The average length for this web site is 10:03 minutes. Anyway, 77 % of users has spent less than one minute on the site: the time to read the opening hours of the library, or to click away on the faculty's OPAC or Medline database, or... to decide that this is not the site they were looking for. Another important goal, then, is to reduce the percentage of users that spend less than two minutes on the site. "One click users" mustn't necessarily be discouraged, and short time spent on the site means also that you have rapidly found the information you were looking for. Increasing the number of users spending more time on the site, anyway, is an absolute priority. Graph 4
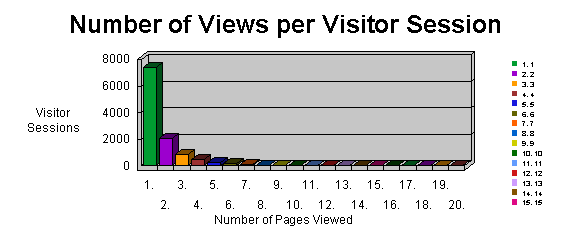
A complementary parameter is shown in graph 4: the number of page viewed is proportional to the duration of the visits. In 63% of visits, users have downloaded only one web page from the site. Finally, two questions: which users who have visited the site most extensively, and where do they come from? Table 3
One of the many possible analysis
strategies is to determine how many users access the site from inside or
outside the library's institution. From table 3, we see that in the first
period most of the hits came from within the institution, while in the
final period the situation is exactly the opposite: more than 2/3 of users
access the site from outside the institution. They might not be other (new)
users, though: this might simply mean that institutional users access the
site also from home, for example.
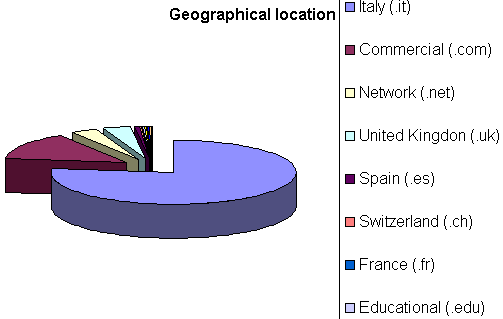
Graph 5
To obtain such analysis it is necessary
to have a reverse DNS lookup performed by the log analysis software connected
to the Internet. This operation allows to obtain domain names from numeric
IP addresses. It should be noticed that not every suffix corresponds to a
geographical location: while .edu is usually referred to north american
universities, suffixes such as .com or .net can correspond to a server
located virtually anywhere.
Technical analysis These data are more interesting to
the server administrator than to the librarian webmaster. They include
number of visitor sessions by day of the week and by hour of the day: in
order to prevent problems with the server, it is important to know when
the traffic reaches considerable peaks. The same is true also for the quantity
of data (bandwidth) transferred in certain days or hours. A text-based
web site, without heavy graphics, helps reduce these problems.
Table 4
Almost 15% of hits have resulted
in an error message for the user. The great majority of errors are code
404 (page not found): this means either that the URL in a link (internal
or external to the site) is not correct, or that the user hasn't typed
in the correct URL in the browser, or that the requested page has been
moved without leaving a notice that the change had taken place.
Who points to our site? Using Altavista and Fast Search The best way to establish if the
users of a site reach it from a link in another site or from a search engine
is to enable the referrer function in the server log.
Here are the results: Search with Altavista advanced search
<http://it.altavista.com/s?spage=searchadv.htm> performed 2001-04-28
19.33:
Search with Fast Search advanced
search <http://www.bos2.alltheweb.com/cgi-bin/advsearch> performed 2001-04-28
19.40:
The use of such tools, though, usually doesn't give very clear results, since we don't know how many pages they index and to which geographical location these pages belong. E-journals Introduction The library's web site delivers access
to 160 e-journals (2000-10-31), both through direct access to publishers
sites and through packages such as EBSCO online and Ovid. The only data
available come from Ovid and EBSCO gateways, since most of the publishers
don't disclose to librarians the figures of online access for their users.
As a result, 94 journals (45 through EBSCO online, 49 through Ovid) - 58.75%
of total - were available for the analysis.
Data from OVID The Pediatric and Adolescent Medicine
Library of the University of Turin accesses 49 online full text journals
(SGML format) through the Ovid package, grouped in the Core Biomedical
Collection, Nursing Collection and Nursing Collection II.
The number of potential users amounts to approximately 1000 people: clinicians, researchers, nurses and administrative staff. To analyze the usage data I have used Ovid Statistics Viewer, the statistical analysis package available with Ovid package local version 7.8. Table 5
Full text articles on these journals have been accessed 690 times in 6 months. The first ten journals, are medical journals, with only two exceptions. It should also be noticed that some journals from the list are freely available on the Internet (BMJ) and others (Lancet, New England Journal of Medicine, Pediatrics) were also available via the library's web site from the publisher's site. Particular attention should be paid to the fact that 9 journals out of 49 (18,4%) were not accessed at all, and 27 out of 49 (55,1%) were accessed less than 5 times. Also the overall usage of these resources was very low: 690 accesses for 1000 potential users in 6 months, at a rate of 0,115 accesses per potential user per month. Journals usage data have been divided by network (gynecological vs. pediatric) and by subject (medical vs. nursing). Let's consider now the usage per network and per subject category: Table 6
E-journals were significantly more consulted in the gynecology network (66,81% on total full text hits). In both networks medicine journals were more read than nursing journals. These data are rearranged in table 7: Table 7
A thorough evaluation of these data
is still due.
Data about EBSCO online 45 journals are available via EBSCO online <http://www.ebsco.com/online/>. The articles are available in PDF o Real Page format. Usage data were analyzed on 2001-02-07 using the EBSCO Online usage report. Usage reports were available since 2000-03-05 to 2001-01-19 for one group and from 2000-02-22 to 2001-01-19 for another. Since the difference is slight (9 days out of 331) the journals have been merged into a single list only for statistical purposes. The potential users are estimated in approximately 1500, though no exact figure is available. These titles were available since the list of e-journals of the library's web site and were accessible either by IP recognition for computers inside the institution or by login and password outside the institution. Thus, it is important to notice that the possibility to access these titles is higher than for the Ovid ones, accessible only via IP recognition. Parameters used to analyse the use of these journals are more detailed as far as the single journal usage is concerned. It is possible to measure how many hits were on the journal, and how many on the tables of contents, abstracts and full text articles. Table 8 shows the titles sorted by number of full text article hits.
Table 8
Conclusions The only comparable data (full text
article hits) show that journals accessed through EBSCO Online were significantly
more used (211 hits per month vs. 115). Considering a greater audience
for EBSCO journals, though, the number of full text hits per user per month
is only slightly higher (0,140 vs. 0,115).
To finish, just a note about the
difficulty and the necessity of comparing paper and electronic journals.
On the other hand, paper journals
usage statistics tend to be less precise and detailed. Nonetheless, they
must be compared in order to plan an efficient transition to a digital
library from a hybrid one.
Ovid Databases Overview Ovid databases are accessible to
the same users and in the same way as the Ovid full text journals. Data
on their usage were obtained through the same tool, Ovid Statistics Viewer.
Here is the list of databases available:
The two EBM Reviews are full text
databases (to be precise, Best Evidence offers "enhanced abstracts"), the
others bibliographic ones. Medline, Pre-Medline and CancerLit are also available
free of charge on the Internet, and this might have affected their access
through Ovid.
Database usage in a time period The following table summarizes the main parameters considered for the overall usage of Ovid databases. Table 9
The same data are also available divided for the single databases. The highest figures in each column are highlighted. Table 10
User's behaviour: patterns of searches In order to plan an efficient training program to improve user's ability to search on databases, it is vital to know their needs and search habits. Some tips on this subject could be offered by an analysis of the type of searches performed by users on our Ovid databases. The first columns of Table 11 show the number of search sets (single searches performed by a user during a session) the average search sets per session (which indicate the intensity of use of a database during a single session) and the percentage of search sets for a single database on the total of search sets for all databases. Medline turns out to be the most used database in general both in terms of sessions (684 out of 1025) and of total search sets (4746 out of 6674). The most intensively used database during a single session, though, is CINAHL (7,9 average sets per session, vs. 6,9 for Medline). Author, journal name and title searches are generally performed only by few users, with the exception of Pre-medline, where author searches are 14% of the searches performed in the database. A good percentage of users, instead, performs subject searches (43% for all databases, with a figure of 54% in CINAHL and 53% in Medline). This good percentage is also a consequence of the fact that Ovid performs an automatic mapping of a search string to MeSH terms in Medline and to CINAHL subject headings in CINAHL. The use of search operators is widespread for the best known ones: AND (23% of searches) and OR (30% of searches). Besides, the percentage of searches in AND or OR is underestimated due to the fact that - following strictly the path proposed by Ovid - users have to perform two separate searches and then to combine them in a third separate search selecting either OR or AND by a menu. In this menu, though, are not present other boolean operators such as NOT, ADJ or FREQ. This should account for the fact that only very few searches use the operator NOT (0,21% of total search sets) and almost none ADJ or FREQ. Table 11
Table 12
Conclusions A more thorough knowledge of the full potential of Ovid database is required, both for librarians and for users. As in every system, not always the most interesting features are also the most prominent - sometimes they are hidden somewhere or require direct typing of a string. As for users, a systematic training program should be built in order to teach the different possibilities offered by the various types of searches and operators. Obviously, figures and statistics
don't tell everything. Another important preliminary step
could be a questionnaire to assess if users usually find what they want
or not (or in what percentage). The fact that a particular search was performed
doesn't tell us if it provided the user with the correct result. Also a
high number of searches performed per set could mean either that a user
has successfully searched for different subjects or has encountered difficulties trying different search strategies for the same goal.
A direct feedback from users is thus
necessary: figures alone are not enough.
General Conclusions
This study accounts only for a first
experiment, with many limits both in method and in conclusions.
No absolute truth can come out of it, but at least some general tips on
how to begin to search for evidence about how users face digital libraries.
Consequently, I would like to focus
on two main issues that could be interesting for further research on the
subject:
Firstly, the need for internationally
acknowledged guidelines for the analysis of this kind of data. Particularly,
a set of basic parameters is strongly needed and an agreement on what each
parameter means - let's think for example of the elusive meaning of the
word "visitor". No rigid structures, but a set of tools to improve both
the comparability of various analyses performed in different contexts.
Besides, the set of parameters should have the necessary flexibility to
be adapted to the particular needs of local communities of users.
Secondly, a more uniform format for
data. Pre-packed software for log analysis suffers from heavy limitations.
What I have found abut the analysis of usage data for e-journals and databases
are very rigid tools with almost no ease for personlization, and -
what is more - no direct access to raw data. This last point is vital,
though. Only studying directly the server logs and configuring them from the beginning in an appropriate
way it is possible to obtain more precise results.
Both issues need surely a wide international
debate, as also J. Luther notes in her excellent White Paper on Electronic
journal Usage Statistics (see bibliography). I hope my study could contribute
to this debate.
References
1. Benjamin I, Goldwein JW, Rubin
SC, McKenna WG. OncoLink: a cancer information resource for gynecologic
oncologists and the public on the Internet. Gynecol. Oncol. 1996; 60:8-15.
7. Credits
The author wishes to thank C. Tortorelli, E.
Gatto and G. Boiero for their invaluable help. |
||||||||||||||||||||||||||||||||||||||||||||||||||||||||||||||||||||||||||||||||||||||||||||||||||||||||||||||||||||||||||||||||||||||||||||||||||||||||||||||||||||||||||||||||||||||||||||||||||||||||||||||||||||||||||||||||||||||||||||||||||||||||||||||||||||||||||||||||||||||||||||||||||||||||||||||||||||||||||||||||||||||||||||||||||||||||||||||||||||||||||||||||||||||||||||||||||||||||||||||||||||||||||||||||||||||||||||||||||||||||||||||||
|
|
|
||||||||||||||||||||||||||||||||||||||||||||||||||||||||||||||||||||||||||||||||||||||||||||||||||||||||||||||||||||||||||||||||||||||||||||||||||||||||||||||||||||||||||||||||||||||||||||||||||||||||||||||||||||||||||||||||||||||||||||||||||||||||||||||||||||||||||||||||||||||||||||||||||||||||||||||||||||||||||||||||||||||||||||||||||||||||||||||||||||||||||||||||||||||||||||||||||||||||||||||||||||||||||||||||||||||||||||||||||||||||||||||||
